
Living on the U Street Corridor
Living on the U Street Corridor
Key Highlights:
- Housing character — 1870s–1900s Victorian rowhouses, many split into condo flats, plus 2000s condominiums around 14th and U Streets
- Green space — small triangle parks, with Meridian Hill Park a short walk north
- Daily essentials — Trader Joe's at 14th and U, restaurants and shops along U Street and 14th Street
- Transit — U Street Metro (Green/Yellow); D50/D5X on 14th Street and D60/D6X on 16th Street
- Schools — DCPS boundaries vary by block; confirm any address with the DCPS school finder
- Market character — about 110–115 sales a year, split between condos and rowhouses
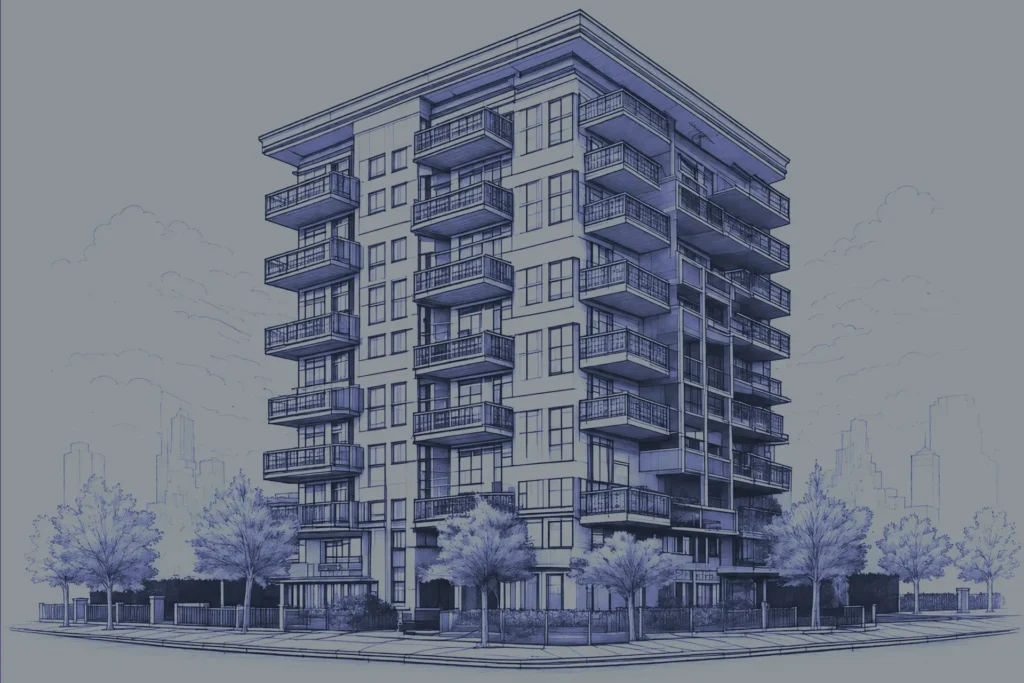
Notable Condo Buildings in U Street Corridor
U Street Corridor Real Estate FAQs
Insight into the nuances of buying and selling in one of the country’s most complex urban markets.
Is the U Street Corridor a good place to live?
Where is the U Street Corridor?
Is there a Metro station on U Street?
What types of homes are on the U Street Corridor?
How much do homes cost on the U Street Corridor?
How fast do homes sell near U Street?
What is there to do on U Street?
Which condo buildings are on the U Street Corridor?
Location & Neighborhood
Culture at the Doorstep
Neighboring Area:
- Shaw — east, beyond 9th Street
- Logan Circle — south, below S Street
- Dupont Circle — southwest, across 16th Street
- Columbia Heights — north, across Florida Avenue
- Adams Morgan — northwest
A Day In The Life - Snapshot
The quick details buyers ask about most.
U Street Corridor Market Snapshot
Median Sales Price
Median Price Per Sq Ft
Median Days On Market
Annual Closed Sales
YoY Median Price Change
The U Street Corridor is a two-product market, split between condominiums and rowhouses. The snapshot covers every closed sale inside the corridor boundary over the trailing twelve months through September 2026 — 56 condominium sales and 54 rowhouse and semi-detached sales. Price per square foot uses interior living area.
Across all home types the median sale was $787,500 at about $620 per square foot, with a median of 23 days on market and sales averaging 96% of original list price. Overall prices were flat, but the segments diverged: the condo median fell about 17% to $500,000, while rowhouses held near $1.26 million. Days on market lengthened for both, giving buyers somewhat more time than a year ago.
Market data reflects recent 12-month activity. Individual buildings may vary.
For Sale
Homes for Sale in U Street Corridor
See all U Street Corridor listings
Don’t see the right home?
We track private and off-market opportunities before they reach the MLS.
Recently Sold
Recently Sold in U Street Corridor
Closed sales from the past 12 months — the comps that set today’s pricing.
See more closed sales
Wondering what your home could sell for?
Get a pricing strategy built on these comps and current U Street Corridor demand.
In-Depth Market Analysis
U Street Corridor Market Insights
How pricing trends, absorption rates, and inventory levels are shaping buying and selling
Inventory & Absorption
Pricing Dynamics
Buyer Profile
Strategic Outlook
Market Position Overview:
Inventory Level: Balanced with selective competition
Negotiation Environment: Moderate flexibility
Typical Days on Market: 25-45 (well-priced units)
Rental Demand: Consistent due to transit proximity
Long- Term Outlook: Stable, walkability-driven value
U Street Corridor Housing & Architecture
Condo Buildings
Condo Buildings in U Street Corridor
Building-by-building guides with amenities, fees, recent sales and what's for sale now.
Nearby neighborhoods
Close to U Street Corridor
Ready to Talk About Your Next Move?
We’ll listen first, then recommend a strategy that fits your goals and timing.