
Living in Cathedral Heights
Living in Cathedral Heights
Key Highlights:
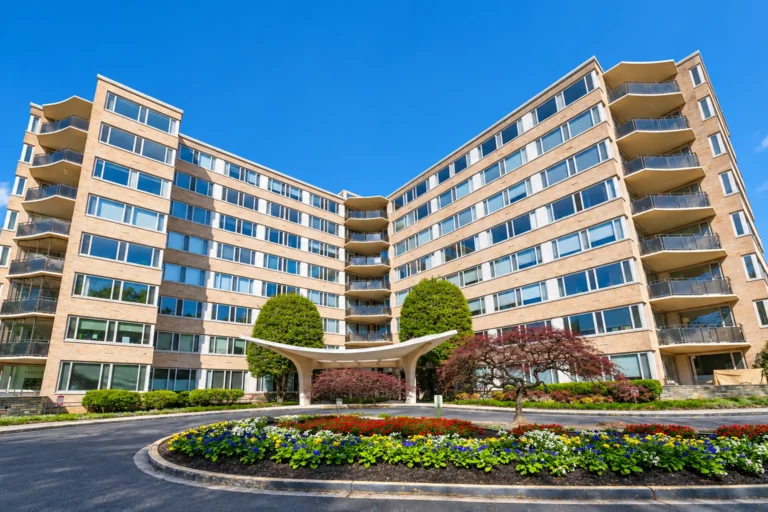
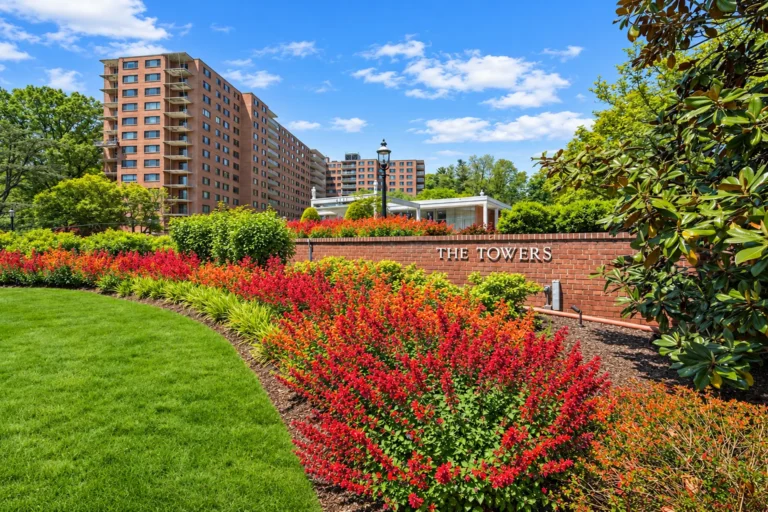
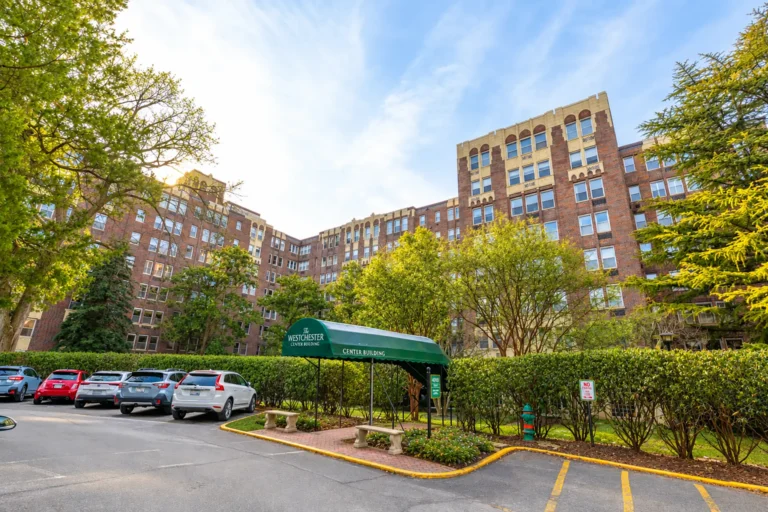
- Housing character — landmark co-ops and condominiums on Cathedral Avenue, 1920s–30s houses on the side streets
- Green space — Glover-Archbold Park trail, Newark Street Park, and the Cathedral's Bishop's Garden
- Daily essentials — Cathedral Commons: Giant, CVS, restaurants, fitness, and a weekend farmers market
- Transit — D80 bus on Wisconsin Avenue; Tenleytown-AU and Cleveland Park Metro about a mile away
- Schools — Stoddert and Eaton Elementary, Hardy Middle, Jackson-Reed High
- Market character — condo and co-op entry points under $300,000; houses trade above $1.5 million
Notable Condo Buildings in Cathedral Heights
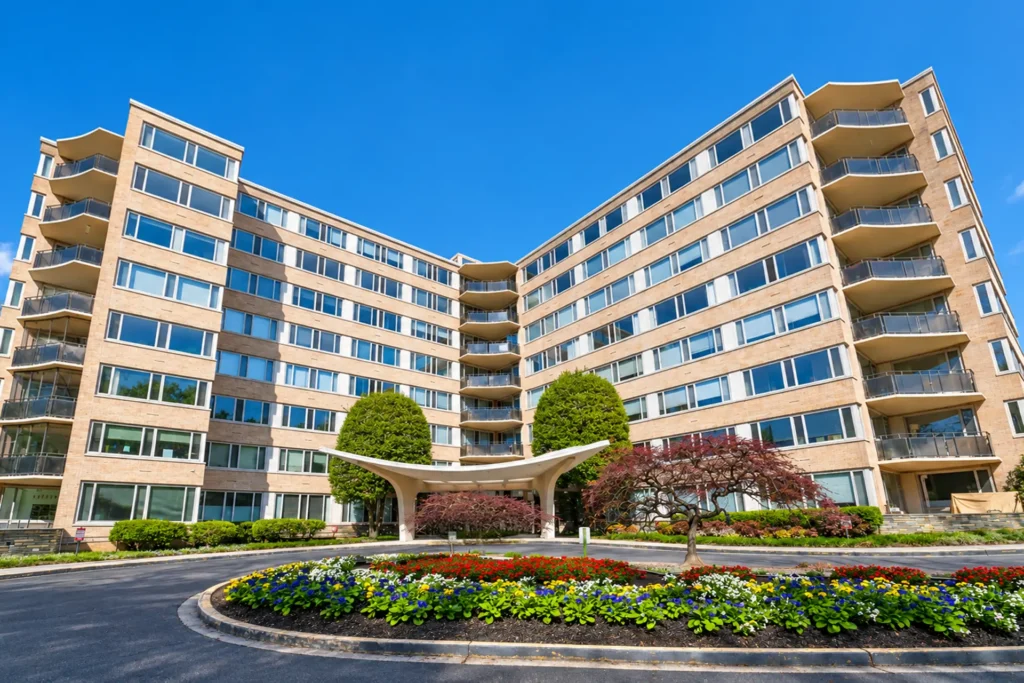
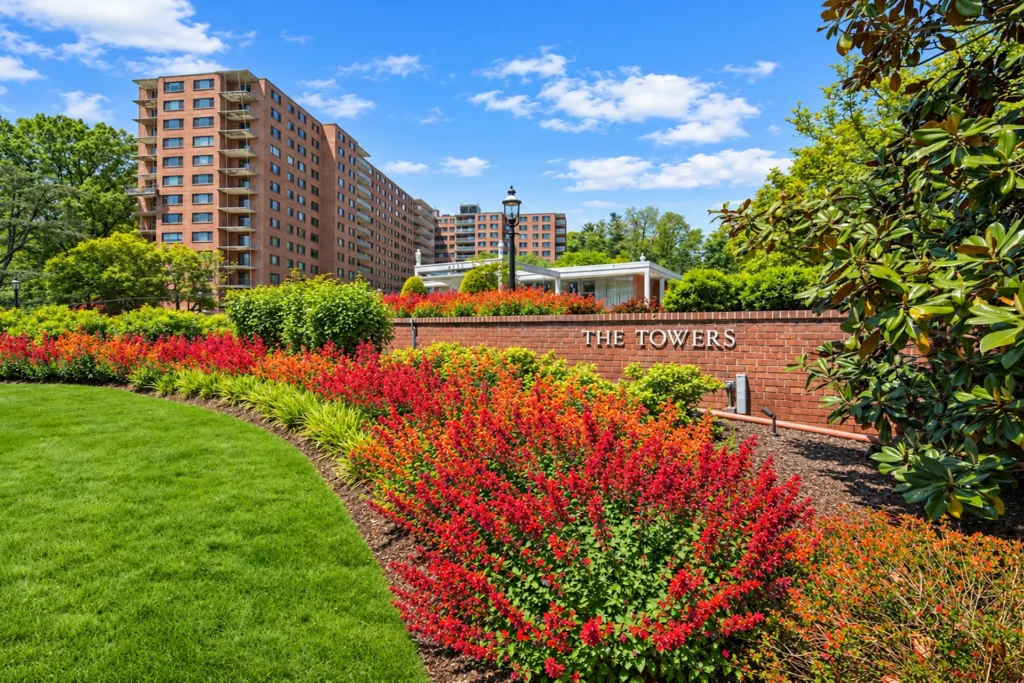
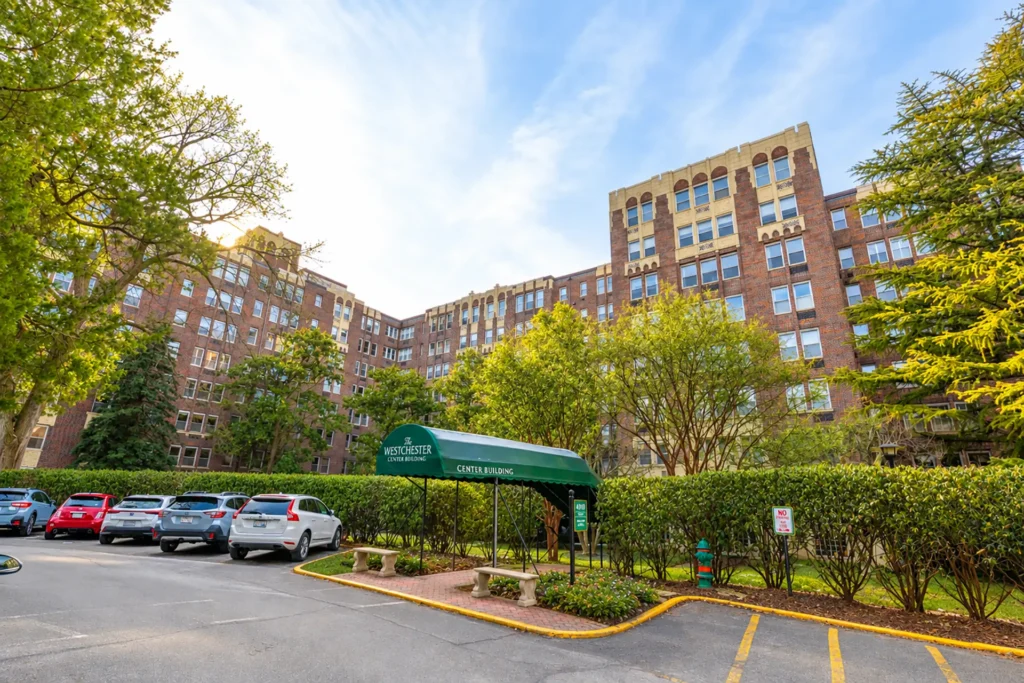
Cathedral Heights Real Estate FAQs
Insight into the nuances of buying and selling in one of the country’s most complex urban markets.
Is Cathedral Heights a good neighborhood to live in?
Where is Cathedral Heights?
Is there a Metro station in Cathedral Heights?
What kinds of homes are in Cathedral Heights?
What is the difference between a co-op and a condo here?
What do homes cost in Cathedral Heights?
Where do residents shop and eat?
What schools serve Cathedral Heights?
A Day In The Life - Cathedral Heights
A visual look at the streets, architecture, and everyday energy that define the neighborhood.
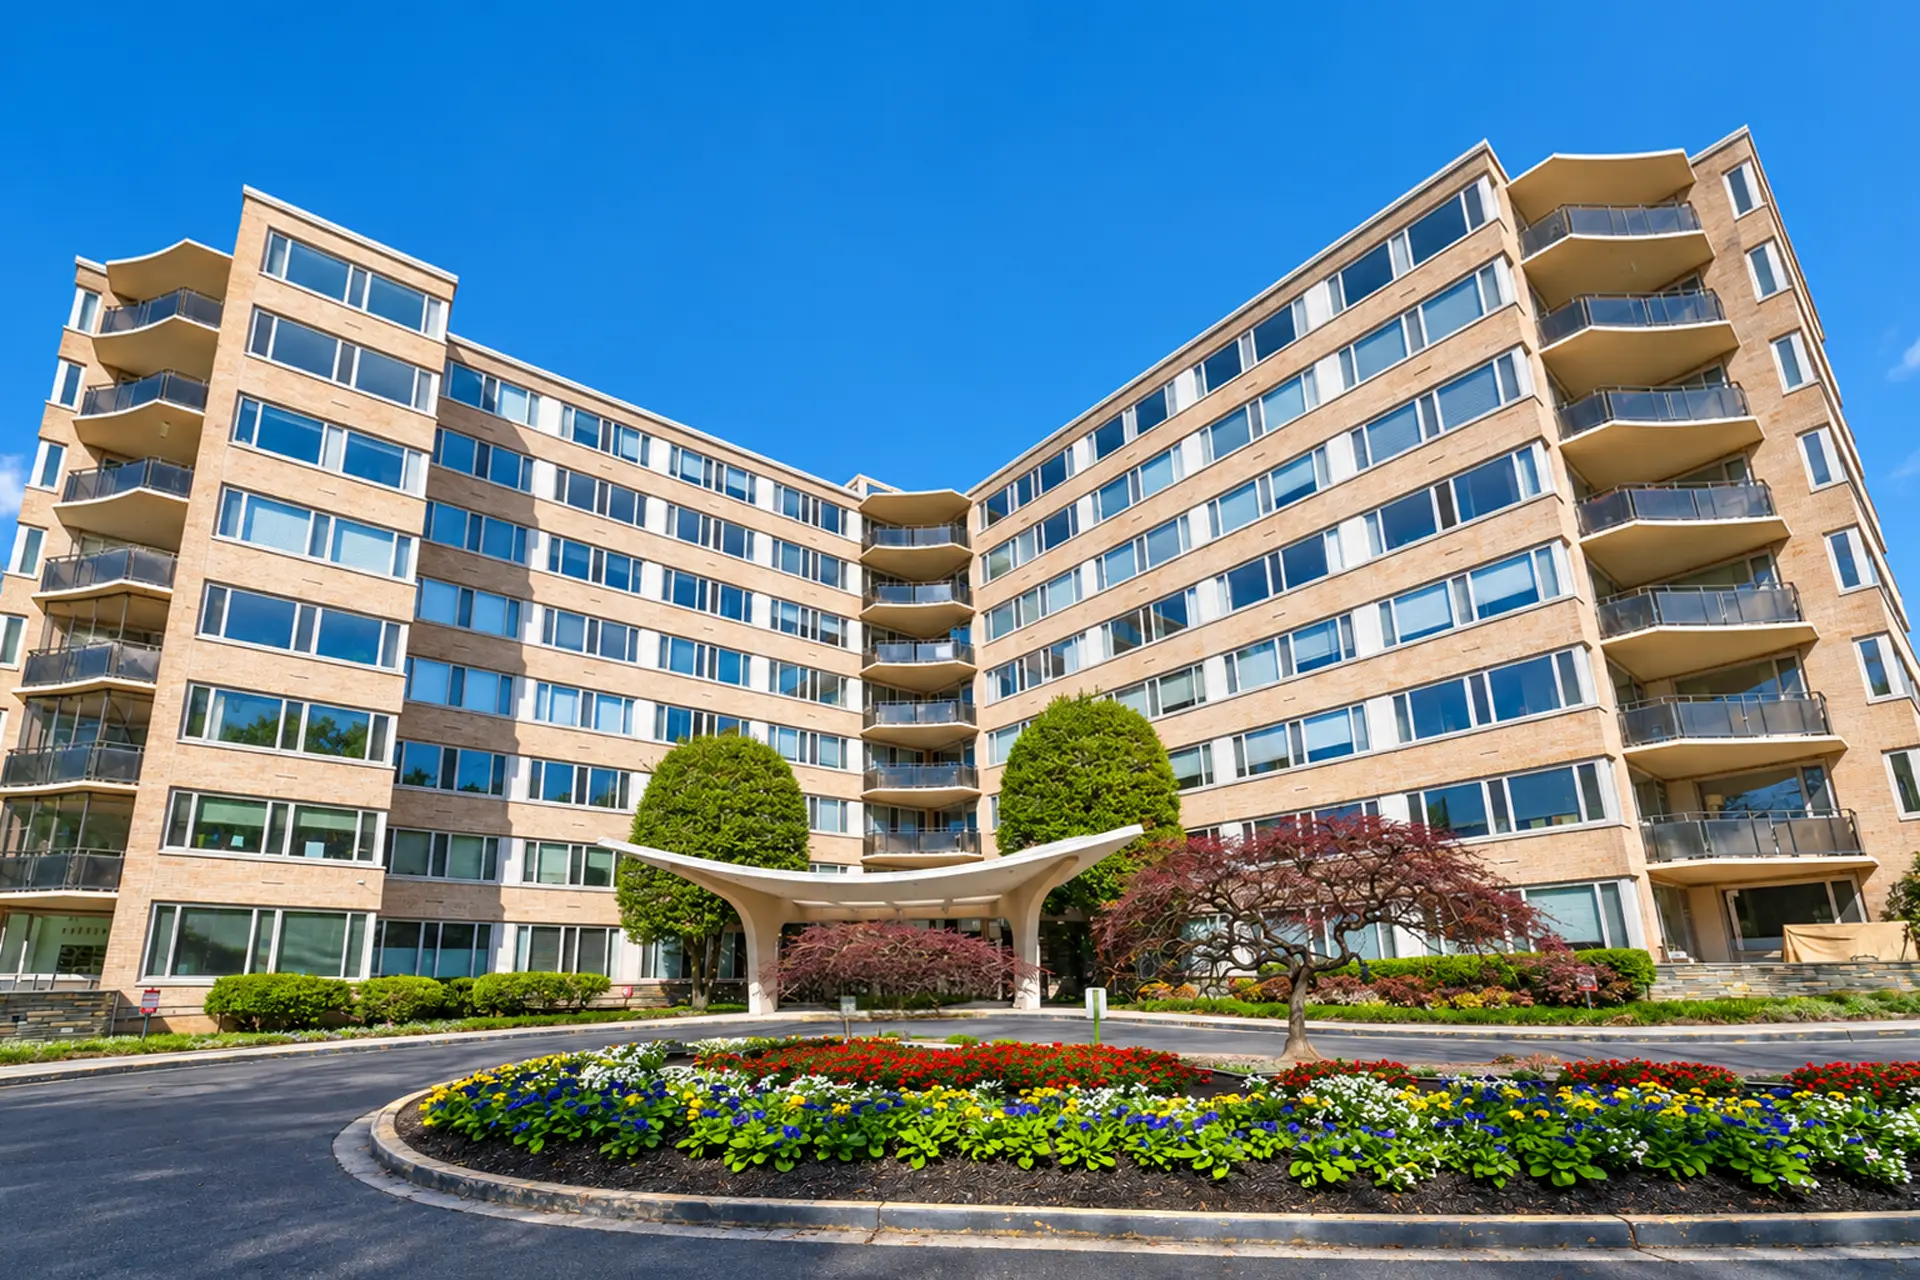
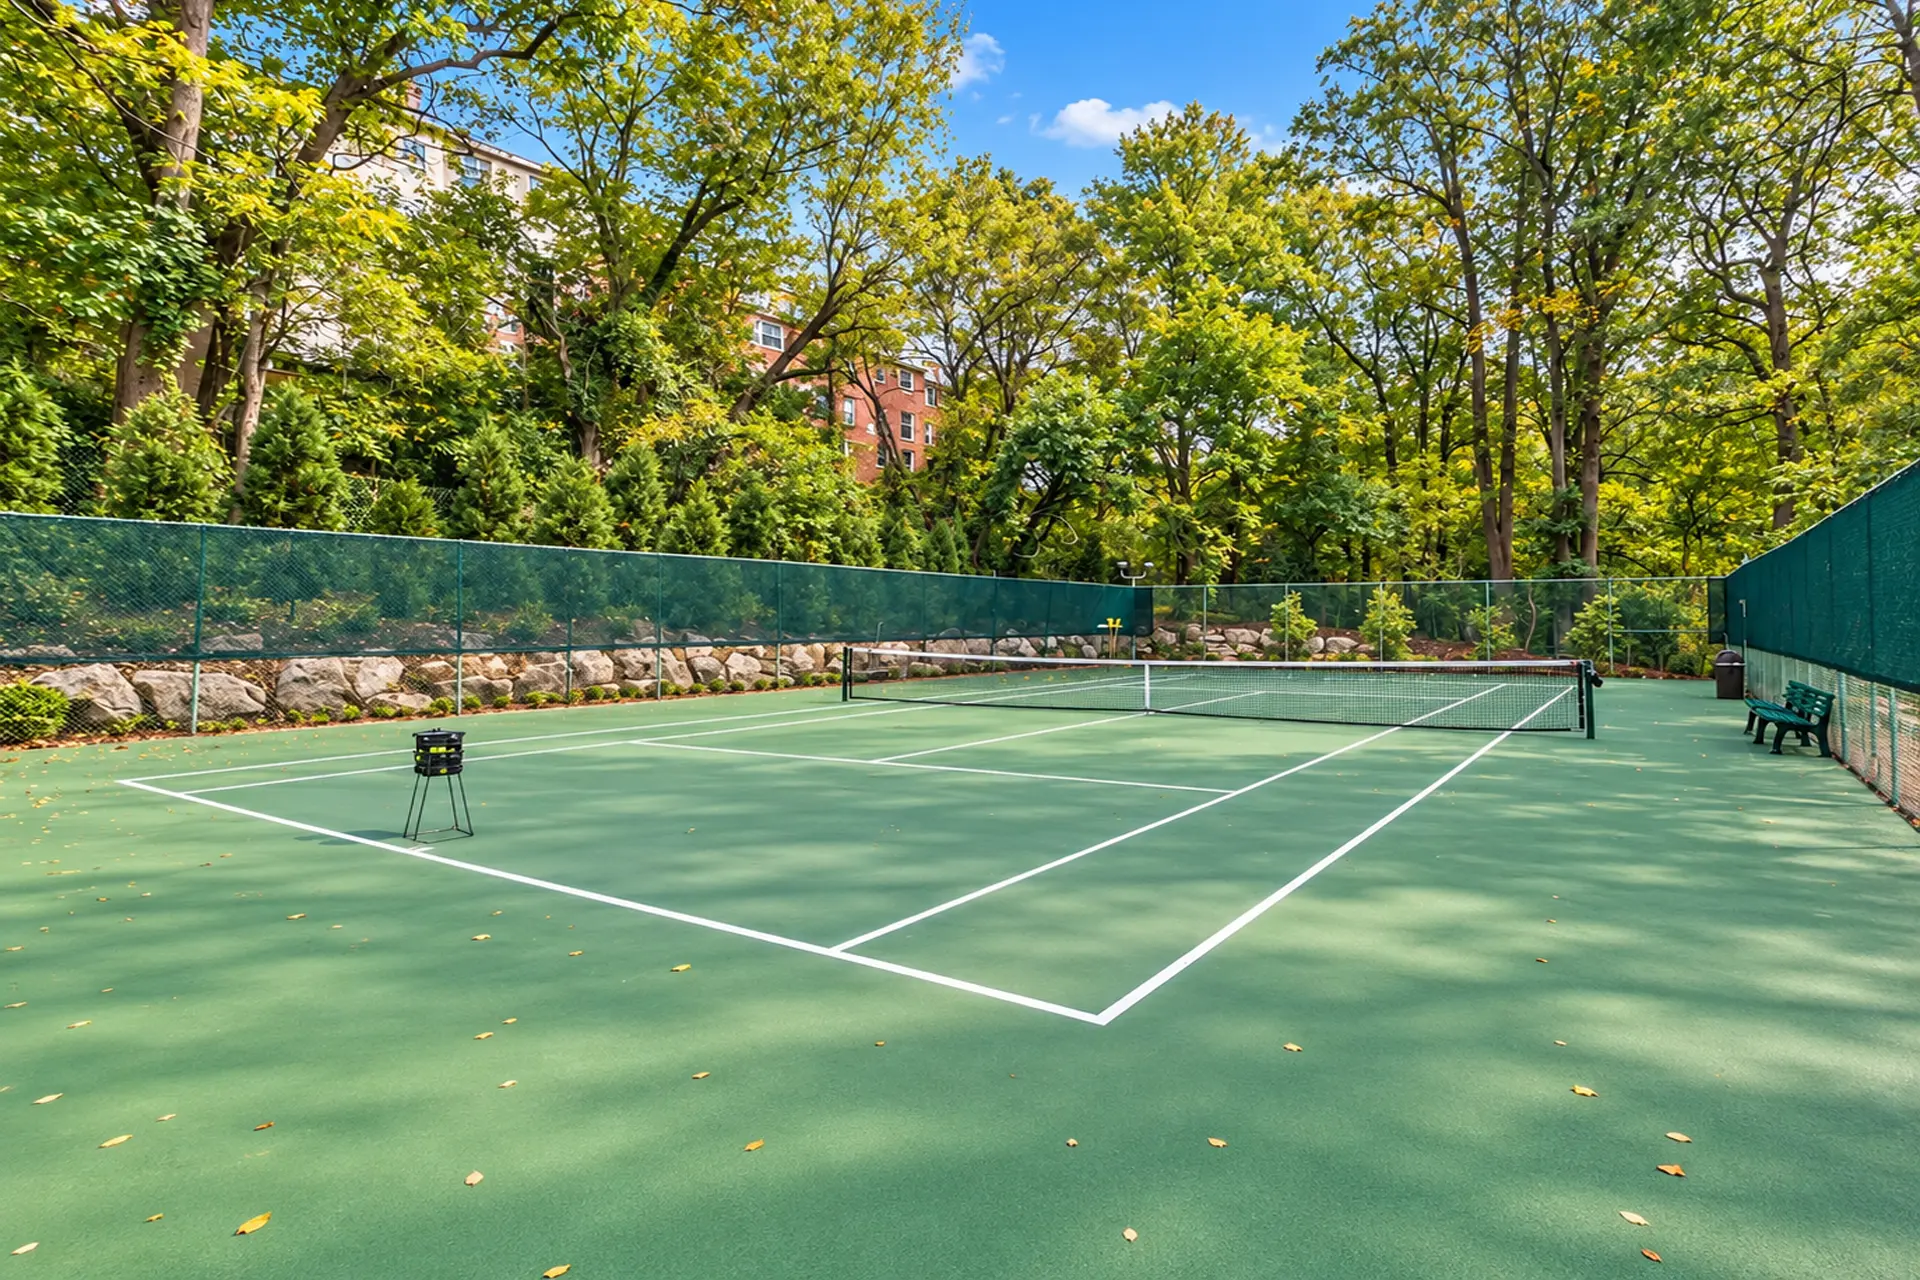
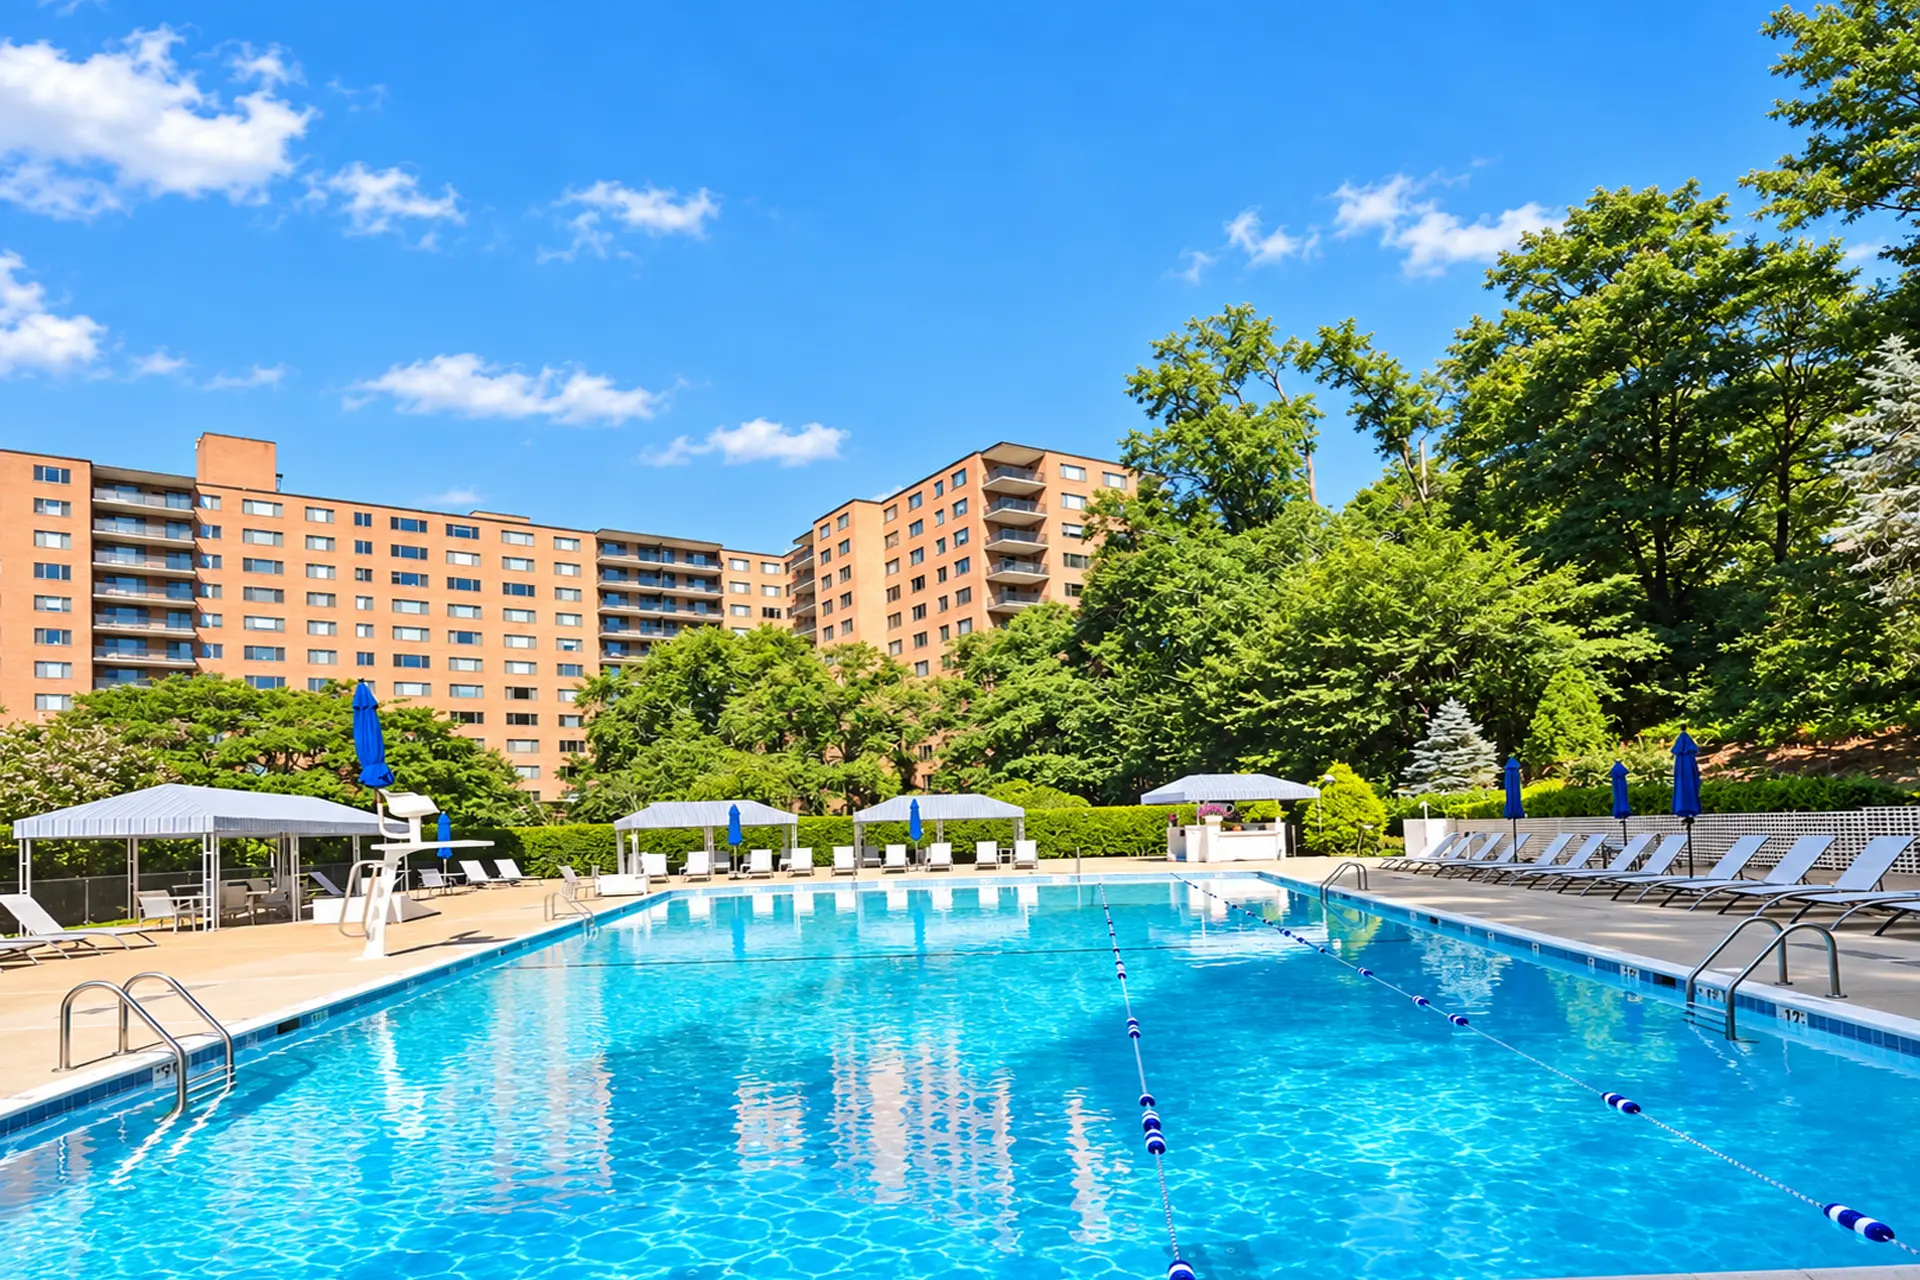
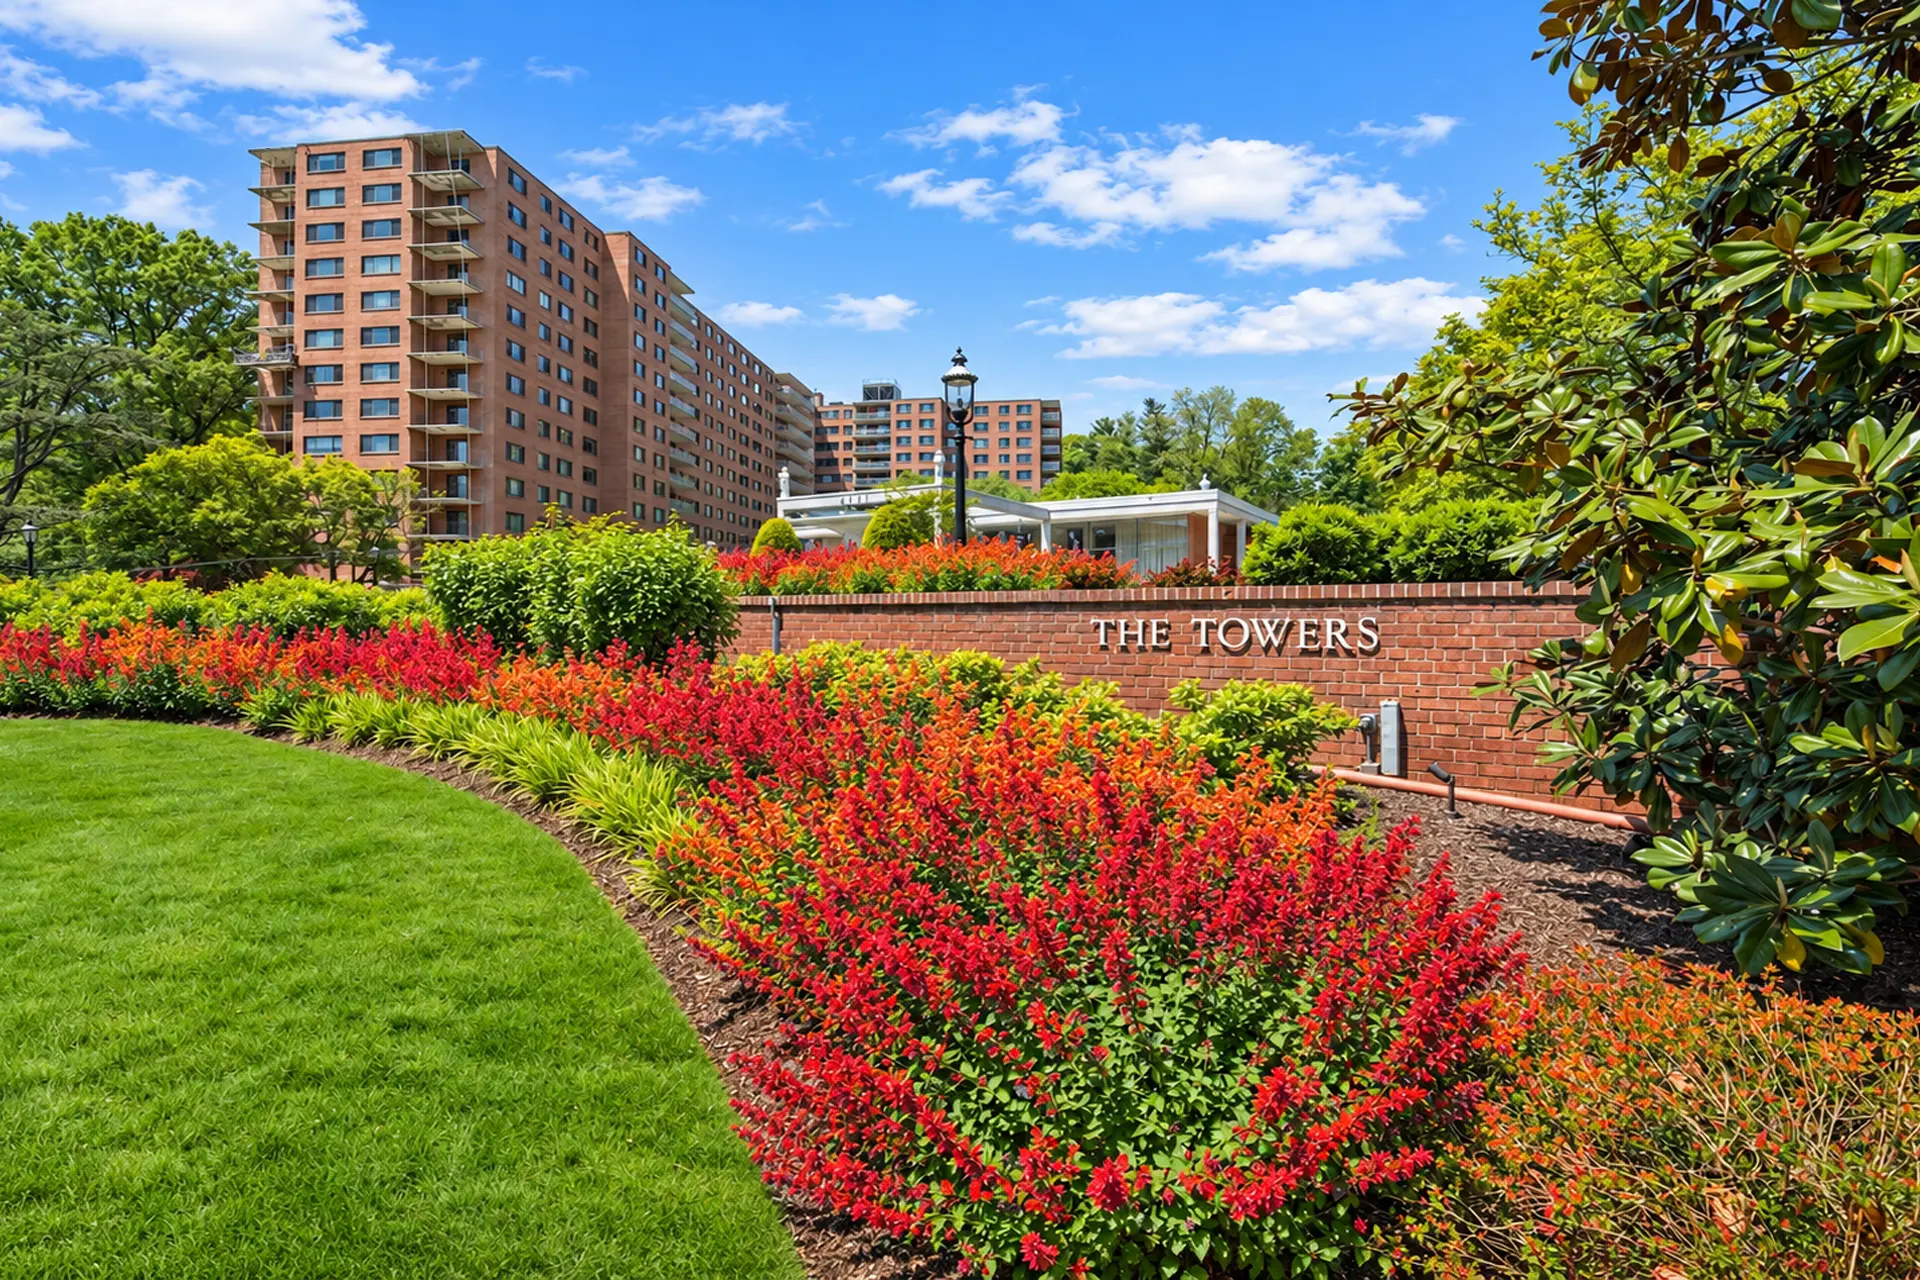
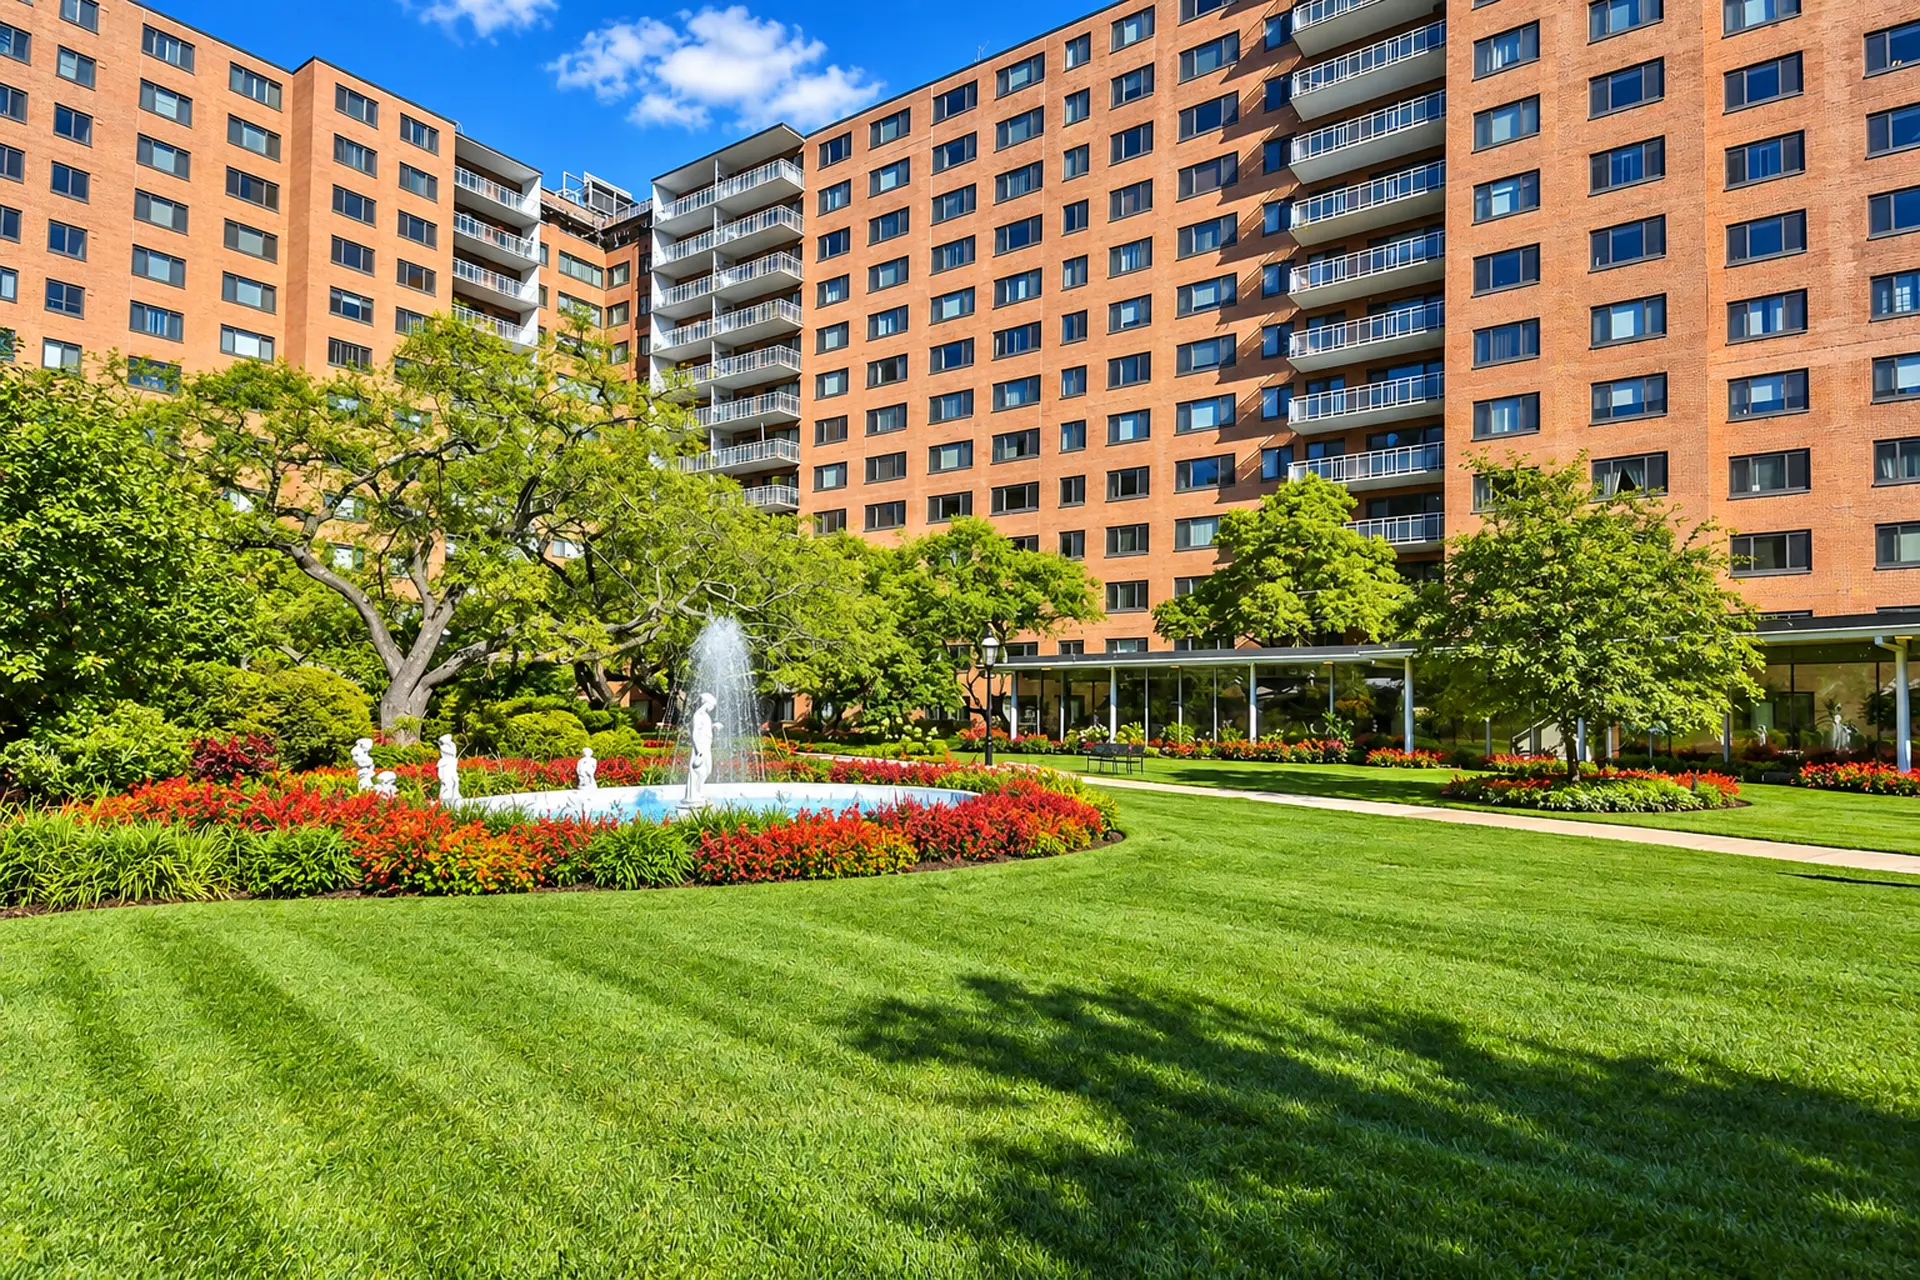
Location & Neighborhood
Quiet Streets, Close to Everything
Neighboring Area:
- Cleveland Park — northeast, across Wisconsin Avenue
- Glover Park — south, along Tunlaw Road and Wisconsin Avenue
- Wesley Heights — west, across Glover-Archbold Park
- Woodley Park and Massachusetts Avenue Heights — east, past the Cathedral
- Tenleytown and American University Park — north
A Day In The Life - Snapshot
The quick details buyers ask about most.
Cathedral Heights Market Snapshot
Median Sales Price
Median Price Per Sq Ft
Median Days On Market
Annual Closed Sales
YoY Median Price Change
Cathedral Heights is a co-op and condominium market with a thin layer of houses on top. The snapshot below covers every closed sale inside the neighborhood boundary over the trailing twelve months through September 2026 — 128 apartment sales and 11 houses. Price per square foot uses interior living area.
Across all home types the median sale was $399,900 at about $363 per square foot, with a median of 50 days on market and sales averaging 93% of original list price. The 8.1% rise in the all-types median is partly mix: the houses, which closed between $1.35 million and $4.5 million, pull it up. Within condominiums and co-ops alone the median rose about 5%, from $342,500 to $360,000, while days on market roughly doubled from the prior year — buyers have more choice and more leverage than they did in 2025.
Market data reflects recent 12-month activity. Individual buildings may vary.
For Sale
Homes for Sale in Cathedral Heights
See all Cathedral Heights listings
Don’t see the right home?
We track private and off-market opportunities before they reach the MLS.
Recently Sold
Recently Sold in Cathedral Heights
Closed sales from the past 12 months — the comps that set today’s pricing.
See more closed sales
Wondering what your home could sell for?
Get a pricing strategy built on these comps and current Cathedral Heights demand.
In-Depth Market Analysis
Cathedral Heights Market Insights
How pricing trends, absorption rates, and inventory levels are shaping buying and selling
Inventory & Absorption
Pricing Dynamics
Buyer Profile
Strategic Outlook
Market Position Overview:
Inventory Level: Balanced with selective competition
Negotiation Environment: Moderate flexibility
Typical Days on Market: 25-45 (well-priced units)
Rental Demand: Consistent due to transit proximity
Long- Term Outlook: Stable, walkability-driven value
Cathedral Heights Housing & Architecture
Condo Buildings
Condo Buildings in Cathedral Heights
Building-by-building guides with amenities, fees, recent sales and what's for sale now.
Nearby neighborhoods
Close to Cathedral Heights
Ready to Talk About Your Next Move?
We’ll listen first, then recommend a strategy that fits your goals and timing.