Do Midterms Slow DC Home Sales? What 14 Years Show

Only a little, and not because of the vote. In 14 years of Bright MLS data for Washington, DC, new contracts in the three midterm falls (2014, 2018 and 2022) rose just 2.6% from the summer on average, versus 8.7% in years with no election. But the two soft midterm falls were the years mortgage rates jumped, and prices didn’t follow the ballot. And this September, DC contracts picked up more from the summer than in any midterm year on record here. If your timing works, the election itself isn’t a reason to wait.
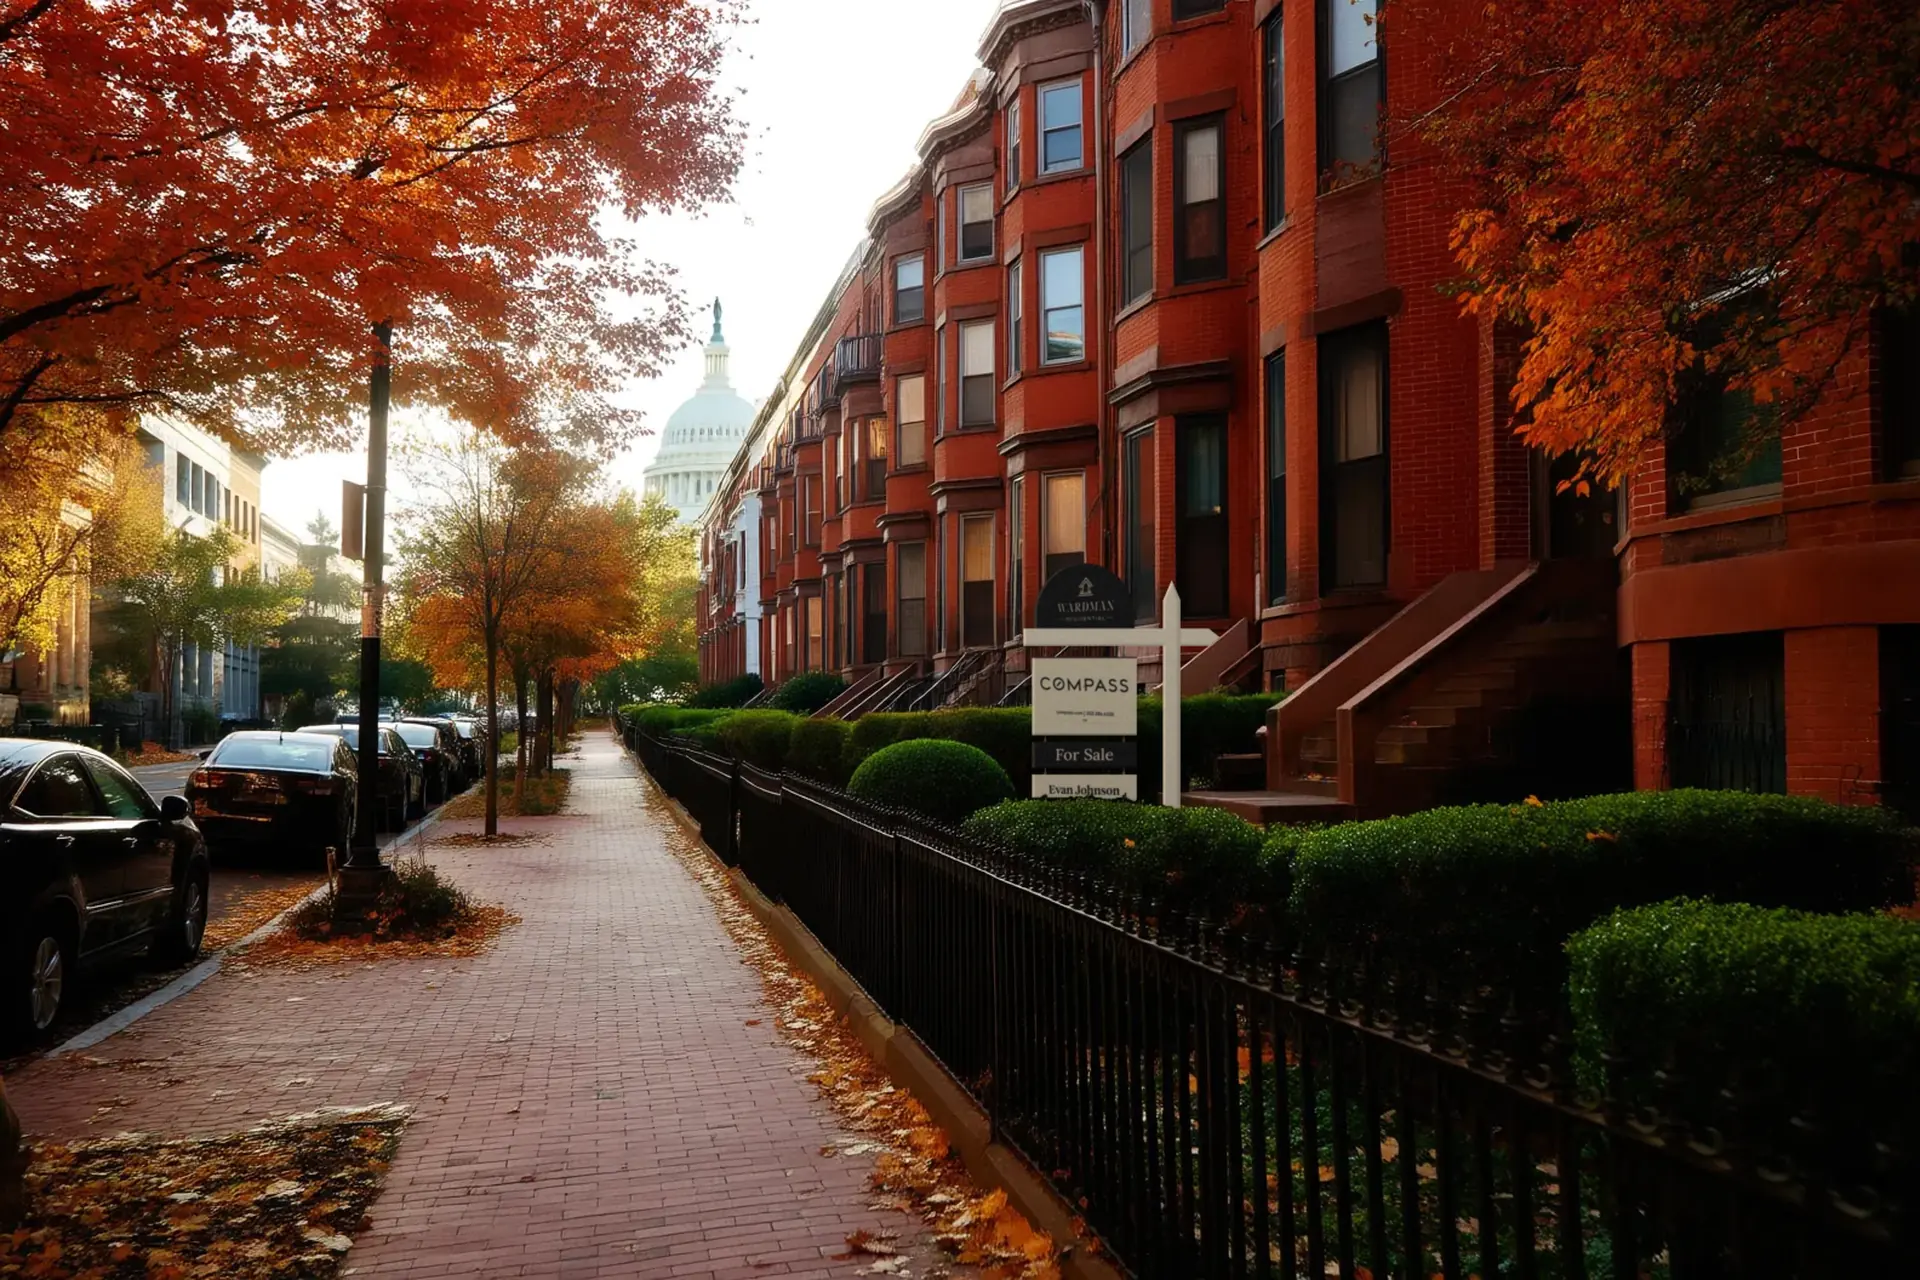
Capitol Hill brick rowhouses in autumn with a For Sale sign in a front garden and the US Capitol dome down the street.

Every election season, buyers and sellers ask me whether they should hold off until the votes are counted. I’ve heard that question in DC for 26 years. So I pulled every month of DC-wide Bright MLS data from September 2012 through September 2026 and looked at what actually happened each fall.

What 14 years of DC data show

The cleanest test is how much contract activity picks up after the summer lull. In a typical DC year, new contracts in September and October run about 9% above July and August as buyers come back after Labor Day. Here is every year since 2013, with the midterm years in bold:

Year Election New contracts, Jul–Aug New contracts, Sep–Oct Fall pickup Oct–Nov median sale price vs. prior year
2013 No election 1,474 1,546 +4.9% +6.7%
2014 Midterm 1,399 1,552 +10.9% +5.0%
2015 No election 1,471 1,666 +13.3% +5.9%
2016 Presidential 1,495 1,603 +7.2% +2.8%
2017 No election 1,610 1,732 +7.6% +0.6%
2018 Midterm 1,576 1,586 +0.6% +9.4%
2019 No election 1,592 1,746 +9.7% −0.3%
2020 Presidential 2,013 1,968 −2.2% +13.0%
2021 No election 1,589 1,823 +14.7% +5.5%
2022 Midterm 1,289 1,241 −3.7% −9.4%
2023 No election 1,128 1,132 +0.4% +1.4%
2024 Presidential 1,003 1,297 +29.3% +3.5%
2025 No election 1,005 1,113 +10.7% +2.3%

Averaged by type of year, the fall pickup looks like this:

  • No election: +8.7% (seven years)
  • Presidential election: +11.4% (three years)
  • Midterm election: +2.6% (three years)

On its face, that looks like a midterm effect. Look at the three midterm years one at a time, and it mostly disappears.

Why the midterm falls looked slow

  • 2014: a normal fall. Contracts rose 10.9% from the summer, right in line with a typical year, and the October–November median price was up 5.0% from a year earlier.
  • 2018: rising rates. The fall pickup was only 0.6%, and that November the 30-year fixed rate averaged 4.94%, its highest level since February 2011. Prices didn’t flinch: the October–November median rose 9.4% from a year earlier.
  • 2022: the rate shock. Contracts slipped 3.7% from the summer, and the median price fell 9.4% from a year earlier, as the 30-year rate reached 7.08%, near its highest level since 2002.

The tell is 2023, a year with no election at all. Rates kept climbing, to 7.79% in late October, and the DC fall pickup was 0.4%, just as flat as 2018. When a DC fall has gone quiet, it has tracked the rate sheet, not the election calendar. National research points the same way. John Burns Research and Consulting looked at 35 years of data and found the usual fall slowdown in home sales was actually a bit smaller in election years than in other years. The national studies focus mostly on presidential years; the DC midterm numbers point the same way. With only three midterms in the data, treat this as a pattern, not a law.

Agent Insight
I’ve heard the “let’s wait until after the election” line in every cycle since 1999, and I’ve rarely seen it change how a fall closes out. What does move a DC fall is the rate sheet. If your plans are set, I’d make the call on price, rate and how long you’ll stay, not on the calendar. The buyers touring in late October tend to be the serious ones.
— Evan Johnson, Wardman Residential at Compass

What it means for your timing this fall

Here is where 2026 stands going into November 3, from the same Bright MLS data:

  • Contracts January through August: 4,476, down 1.8% from 4,558 in 2025.
  • Summer contracts (July and August): 892, about 11% below last summer’s 1,005.
  • Median sale price in August: $681,500, up from $670,000 a year earlier.
  • Median days on market in August: 28, down from 33 a year earlier.

The first fall month is now in, and it’s the most useful number in this article. DC buyers signed 499 new contracts in September 2026, 11.9% above the July–August monthly average of 446. In a typical non-election year, September runs about 7% above the summer average; in the three midterm years since 2014, it averaged about 4%. So far, this fall is picking up faster than usual, not slower.

The year-over-year picture is softer: September contracts were 9.3% below September 2025’s 550, because this summer started from a lower base. The September median sale price was $660,000, down 2.9% from $680,000 a year earlier. DC also has more to choose from than usual: 3,041 active listings in September, about 19% above the five-year September average of 2,564, or 6.0 months of supply versus 4.6. That has more to do with the federal job cuts that Bright MLS has tied to longer market times in the region than with the ballot. If you’re buying: with more listings than usual, and any buyers who do pause for the election out of the way, you have room to negotiate on the homes on the market now. The bigger factor in your monthly payment is the rate, which is why I’d read whether it makes sense to wait for lower rates before deciding to sit out. If you’re selling: if your home is ready, the vote isn’t a reason to pull it. Price it for the market you’re in, and keep an eye on inventory and rates, which I covered in the DMV housing market this fall. To see how prices differ across the city, start with what 32 DC neighborhoods cost to buy.

Frequently asked questions

Do home prices drop in DC before an election?

Not as a rule. In the three midterm falls since 2014, the October–November median sale price in DC rose 5.0% and 9.4% from a year earlier in 2014 and 2018, and fell 9.4% in 2022, the year mortgage rates jumped toward 7%. The price moves followed rates and the broader market, not the vote.

Do buyers come back after the election?

The national evidence says the ones who wait mostly return quickly. Redfin found that, after controlling for mortgage rates, October and November home sales in presidential election years averaged only about 0.4% higher than in other years, going back to 1980. In DC, the fall pickup in election years has been driven more by rates than by the result.

Should I wait until after November 3 to list my home in DC?

Only if your home or your plans aren’t ready. The data doesn’t show the election itself cooling DC demand in a meaningful way. Late October and early November can bring motivated buyers who want to settle before the holidays.

Does a midterm affect DC more than other housing markets?

DC demand is closely tied to federal employment, so national politics gets more attention here, and federal job cuts have weighed on the market since 2025. That is a policy and jobs effect, though, not an Election Day effect. In the numbers, the midterm falls that slowed down were the ones with rising mortgage rates, and the one without a rate shock, 2014, was a normal fall. Bottom line: in DC, a quiet fall has followed interest rates, not the ballot. If you’d like to talk through the timing for your own move, reach out anytime, at Hello@Wardman.ai or 703-447-6137.

Sources: Bright MLS via ShowingTime SmartCharts, Washington, DC, all residential property types, monthly new contracts (new pendings), median sale price, median days on market and active listings, September 2012 – September 2026 (pulled October 17, 2026); Freddie Mac Primary Mortgage Market Survey rates as reported by the Mortgage Bankers Association (2018), Bloomberg (2022) and Freddie Mac (2023); John Burns Research and Consulting; Redfin; Scotsman Guide (Bright MLS commentary, December 2025). Data deemed reliable but not guaranteed.

About Evan Johnson Evan Johnson has helped clients buy and sell homes across Washington, DC, Maryland, and Northern Virginia since 1999, with more than 650 homes sold and $334 million in career sales. He leads Wardman Residential at Compass, where about three-quarters of the business comes from repeat clients and referrals. Reach Evan at 703-447-6137 or Evan@Wardman.ai.

Keep Reading

Related Posts

Explore more Wardman insights on the Washington, DC real estate market, neighborhoods, and homeownership strategy.

Brick Colonial, stone Tudor and porch house on an autumn street in upper Northwest DC, with a For Sale sign behind the hedge.

Crestwood DC vs 16th Street Heights vs Shepherd Park

Detached houses sold for a median $1.62M in Crestwood, $1.19M in Shepherd Park and $1.05M in 16th Street Heights. Here's what drives the gap and what $800K, $1.2M and $1.8M buy.
Brass house key on a leather fob resting on a city street map beside a coffee cup and pencil.

Best Neighborhoods in DC: What 32 Areas Cost to Buy

The best DC neighborhood depends on what you're buying. Median prices, condo and house splits, and days on market for 32 DC neighborhoods, from Bright MLS closed sales, October 2025 through September 2026.
Brick DC rowhouses at dusk with lit windows, an iron fence and a white bicycle parked on the sidewalk.

Selling a Rented Home or Condo in DC: What TOPA Requires

Most DC tenants in a single-family home or condo no longer have a right to buy it, but every owner still owes a notice within three days of an offer. Here's the process, and what an occupied sale costs.

A Smarter Approach to DC Real Estate

Work with a team that understands how pricing, preparation, and positioning come together to create exceptional results in today’s market.