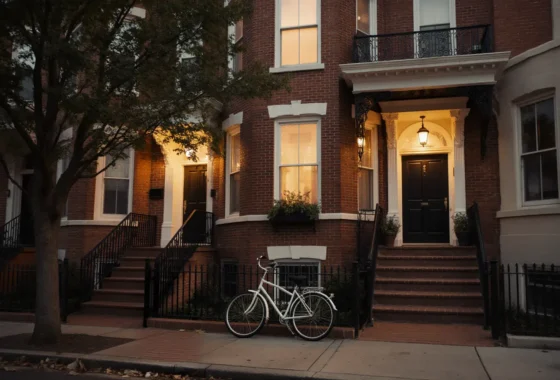

If you’ve been watching the DMV market this fall, here’s the encouraging headline: there are more homes to choose from than there have been in a while, prices are still holding their gains, and buyers finally have real room to negotiate. With mortgage rates now back above 7%, the market is rebalancing, mostly in ways that open up opportunity on both sides of the deal. Here’s what the local numbers actually say, and what they mean for you.
Rates are back above 7%
Rates have climbed, not eased, this fall. As of late September 2026, the average 30-year fixed has pushed back above 7%. The daily indices crossed that line the week of September 21, around 7.0%, up from roughly 6.3% a year ago. Freddie Mac’s weekly average followed on September 24 at 7.03%, its first reading above 7% in more than a year, and the trend all month has been higher, not lower. That single number is shaping everything else.
As Bright MLS Chief Economist Lisa Sturtevant put it: “Mortgage rates have remained persistently high this summer. With home prices still rising, some homebuyers are simply hitting an affordability ceiling.”
When financing costs climb, some buyers pause, others adjust their budgets, and the market gradually shifts from the frenzy of a few years ago toward something more balanced.
The DMV by the numbers (August 2026)
Here’s the part worth remembering: the DMV isn’t one market. Prices are up year-over-year across the board, but each area is handing buyers a different amount of room. These are the latest figures for the three markets most of our clients are considering:
| Market | Median sale price | Year-over-year | Active listings | Months of supply | Median days on market |
|---|---|---|---|---|---|
| Northern Virginia | $710,000 | +0.7% | 5,112 | 2.1 | 15 days |
| Washington, DC | $681,500 | +1.7% | 2,514 | 4.9 | 28 days |
| Maryland Suburbs | $519,995 | +2.8% | 4,157 | 2.8 | 21 days |
A note on these figures: they reflect all residential property types combined. That blend can be misleading — nowhere more than in the District, where a studio condo and a detached home land in the same median. We dig deeper into the DC market, broken out by home type, later in this post.
- Northern Virginia is still the fastest-moving of the three: a well-priced home goes to contract in about two weeks, and at roughly two months of supply it stays competitive. There’s more to choose from than a year ago, but coming in prepared still matters.
- Washington, DC is where buyers have gained the most leverage: supply sits closer to five months and homes are taking about four weeks, which means real room to negotiate on price, terms, and concessions, even as median prices hold up.
- The Maryland Suburbs land in the middle: the most affordable entry point of the three, prices up the most year-over-year (+2.8%), and a healthy-but-not-frantic pace at three weeks and under three months of supply.
The through-line across Virginia, DC, and Maryland is the same: more choice for buyers, and prices still gaining for sellers. That’s not a downturn; it’s a market handing a little leverage back to buyers while sellers keep their equity.
(*Months of supply is how long it would take to sell every home currently listed at the present pace. The lower the number, the more it favors sellers; the higher, the more it favors buyers.)
A closer look: DC by property type
Most headline market numbers, including the ones above, blend all residential property types into a single median. In the District that’s especially misleading, because condos and houses are effectively different markets. Here’s Washington, DC for August 2026, broken out:
| DC property type | Median sale price | Share of DC sales | Sold at (% of original list price) | Median days on market |
|---|---|---|---|---|
| Condominiums | $539,900 | ~43% | 95.4% | 58 days |
| Townhouses / Rowhomes | $834,500 | ~41% | 99.7% | 14 days |
| Detached houses | $1,483,000 | ~16% | 98.1% | 25 days |
That blended $681,500 DC median sits where it does because condos and rowhouses drive most of the volume, and right now those two are moving very differently. Rowhouses are the tightest part of the District: the typical one sold in about two weeks in August, for nearly its full original asking price. Condos are where buyers have the most room. The typical DC condo took about two months to sell (up from about six weeks a year ago) and closed roughly 5% below its original list price; on average, condo sellers received about 94% of their original asking price. Condo sales were also down about 30% from last August while the number of condos for sale held steady. (The August condo median ticked up, but that reflects which condos happened to sell that month rather than individual units gaining value, so we don’t read it as a price trend.) Detached homes are a small, higher-end slice, only about 70 sales in August, and they sold in under four weeks at close to asking. The practical takeaway: when you’re weighing “the DC market,” know which slice of it you’re actually shopping: a condo search and a rowhouse search are two very different conversations.