
Living In Chinatown
Living In Chinatown
Key Highlights:
- Full-service condominiums in the heart of downtown
- Anchored by Capital One Arena and the Friendship Archway
- Gallery Place-Chinatown Metro (Red/Green/Yellow) at the doorstep
- Steps from theaters, museums, and Penn Quarter dining
- Skyline views and modern layouts in many buildings
- Ultra-central location with short commutes
Notable Condo Buildings in Chinatown
Chinatown Real Estate FAQs
Insight into the nuances of buying and selling in one of the country’s most complex urban markets.
Is Chinatown a good neighborhood for long-term living?
Do I need a car in Chinatown?
What types of homes are available in Chinatown?
Is Chinatown busy on event nights?
How do condo fees compare between buildings?
Is parking available?
What is the community character like?
Is Chinatown a good place to buy a condo?
Location & Neighborhood
- NORTH: Massachusetts Avenue NW
- EAST: 5th Street NW (Mount Vernon Triangle beyond)
- SOUTH: G Street NW (Penn Quarter beyond)
- WEST: 9th Street NW
At the Center of Downtown
Neighboring Area:
- Penn Quarter — south, below G Street
- Mount Vernon Triangle — northeast
- Mount Vernon Square and the convention center — north
- Judiciary Square — east
- Downtown / Metro Center — west
A Day In The Life - Snapshot
The quick details buyers ask about most.
Chinatown Market Snapshot
Median Sales Price
Median Price Per Sq Ft
Median Days On Market
Annual Closed Sales
YoY Median Price Change
Chinatown is a small condominium market of full-service buildings around the Friendship Archway and Gallery Place. The snapshot covers every closed sale inside the neighborhood boundary over the trailing twelve months through September 2026 — 26 condominiums and 1 rowhouse. Price per square foot uses interior living area.
Across all home types the median sale was $489,900 at about $618 per square foot, with a median of 29 days on market and sales averaging 94% of original list price. The median fell about 8% from the prior twelve months. Within segments, the condo median fell about 6% to $486,000. With 27 sales in the year, year-over-year figures can swing widely, so recent sales on the same blocks are the better guide.
Market data reflects recent 12-month activity. Individual buildings may vary.
For Sale
Homes for Sale in Chinatown
See all Chinatown listings
Don’t see the right home?
We track private and off-market opportunities before they reach the MLS.
Recently Sold
Recently Sold in Chinatown
Closed sales from the past 12 months — the comps that set today’s pricing.
See more closed sales
Wondering what your home could sell for?
Get a pricing strategy built on these comps and current Chinatown demand.
In-Depth Market Analysis
Chinatown Market Insights
How pricing trends, absorption rates, and inventory levels are shaping buying and selling
Inventory & Absorption
Pricing Dynamics
Buyer Profile
Strategic Outlook
Market Position Overview:
Inventory Level: Balanced with selective competition
Negotiation Environment: Moderate flexibility
Typical Days on Market: 25-45 (well-priced units)
Rental Demand: Consistent due to transit proximity
Long- Term Outlook: Stable, walkability-driven value
Chinatown Housing & Architecture
Condo Buildings
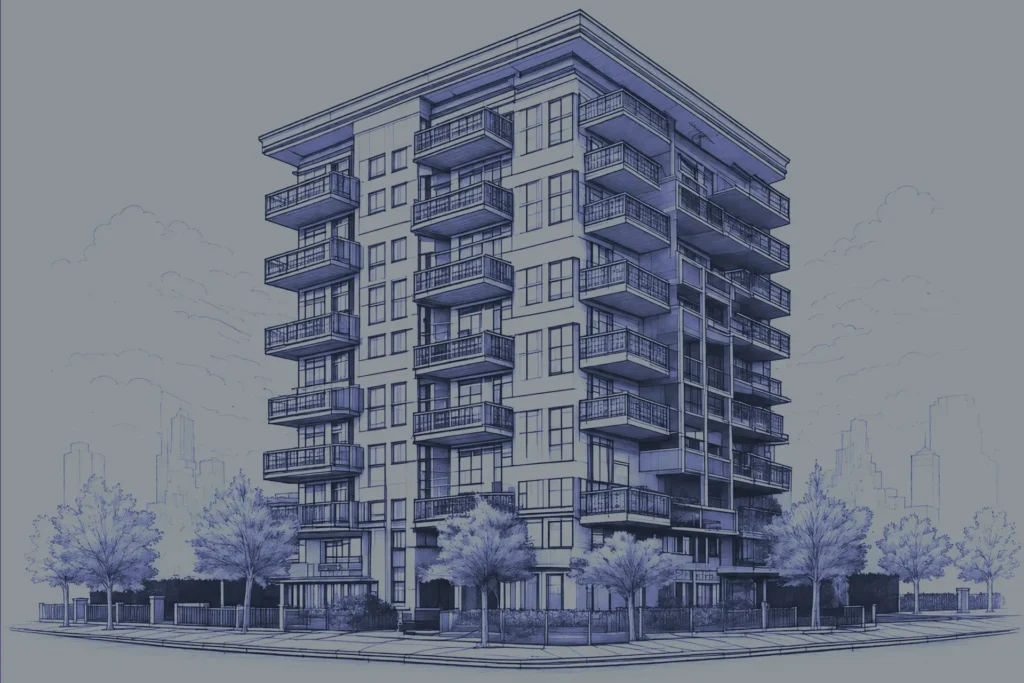
Condo Buildings in Chinatown
Building-by-building guides with amenities, fees, recent sales and what's for sale now.
Ready to Talk About Your Next Move?
We’ll listen first, then recommend a strategy that fits your goals and timing.